






BI analytics for accounting firms — see who makes you money.
Uku turns the time and invoices your firm already runs into live profitability, realization, and utilization — analytics about your firm, not your clients' books.
- Live gauges for realization, utilization, and margin — with the industry benchmark on the dial
- ~30 health signals flag the client bleeding margin before the conversation gets awkward
- Drill from firm → practice area → client in a click. Every number reconciles
4.8 from 300+ reviews · No credit card required
Most "analytics for accountants" tools report on your clients' books. Uku measures your own firm — utilization, realization, capacity, and per-client profit — from the time and invoices you already run.
the healthy realization range
Know instantly where you stand — the benchmark band is right on the gauge, so a number is never just a number.
how much firms over-estimate capacity
Most firms think they have more billable capacity than they do. Uku shows real utilization per person, against target.
spreadsheets to maintain
The report is already built and always current — it reads your live time and invoice data, no manual pulls.
Now that we can see what's actually happening, our decisions have become better.
Christer H., CEO, CHK grupp
Your firm's numbers, live.
Watch realization, utilization, and per-client profit come off the spreadsheet and onto a live console.
Pick a question. The report's already built.
You don't configure widgets or write formulas. Six role-based categories — Production, Revenue & Profitability, Utilization & Capacity, Billing & Payments, Budgets, Monitoring — each already wired to the right KPIs, charts, and health signals.
- Owners and admins see the whole firm; team leads see their own people
- Runs on the time and invoices you already have — nothing to import
- Zero dashboards to build, zero formulas to maintain
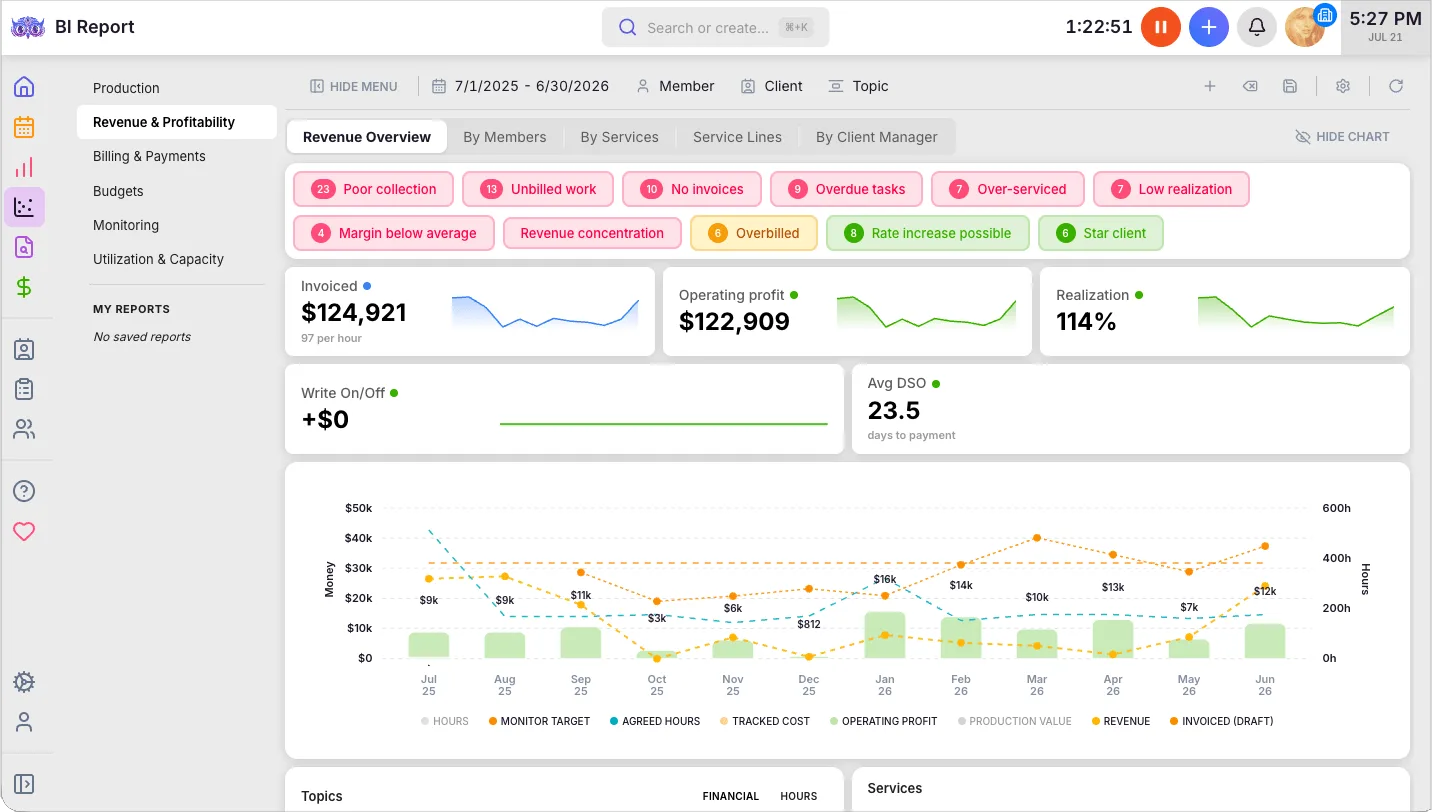
A number means nothing without a benchmark. So we put it on the dial.
Every gauge shows red-amber-green bands and the industry benchmark tick — realization (85–95% healthy), utilization (60–75%), margin — so you know where you stand without hunting for context.
- Trend arrows and period comparison — this month vs last, or year-over-year
- Answers the only question that matters: is this getting better or worse?
- Five profit lenses — production, gross, operating, cash, salary-obligation
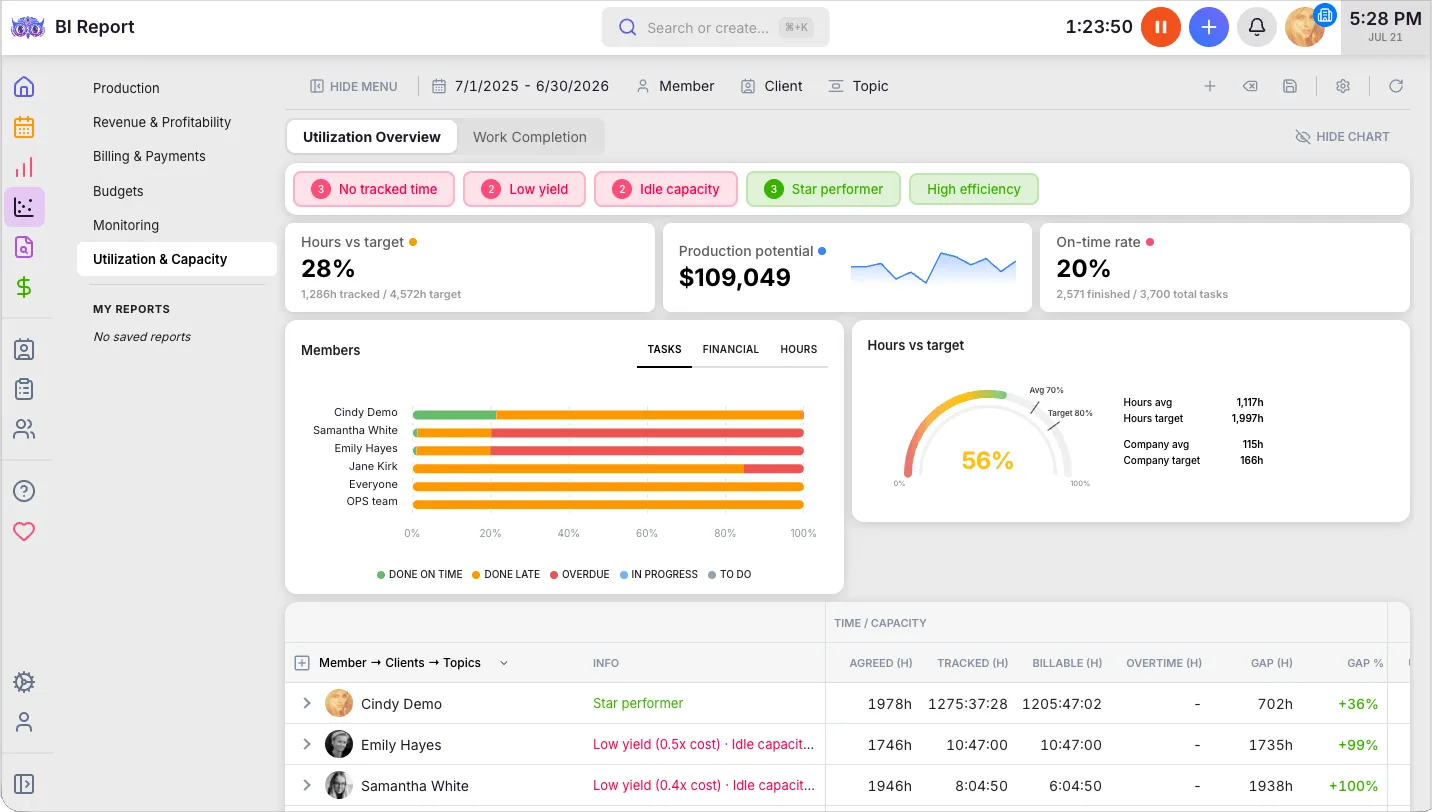
The client quietly bleeding margin lights up red before you'd ever notice.
Uku auto-detects around 30 health signals per client, member, and topic — scope creep, low realization, slow payer, AR-aging risk, fixed-fee loss — plus the positive ones: star client, fast payer, rate-increase opportunity.
- Each signal is an explainable rule, not a black box
- Client Health Score rolls six factors into one 0–100 number
- It tells you what to do, not just what happened
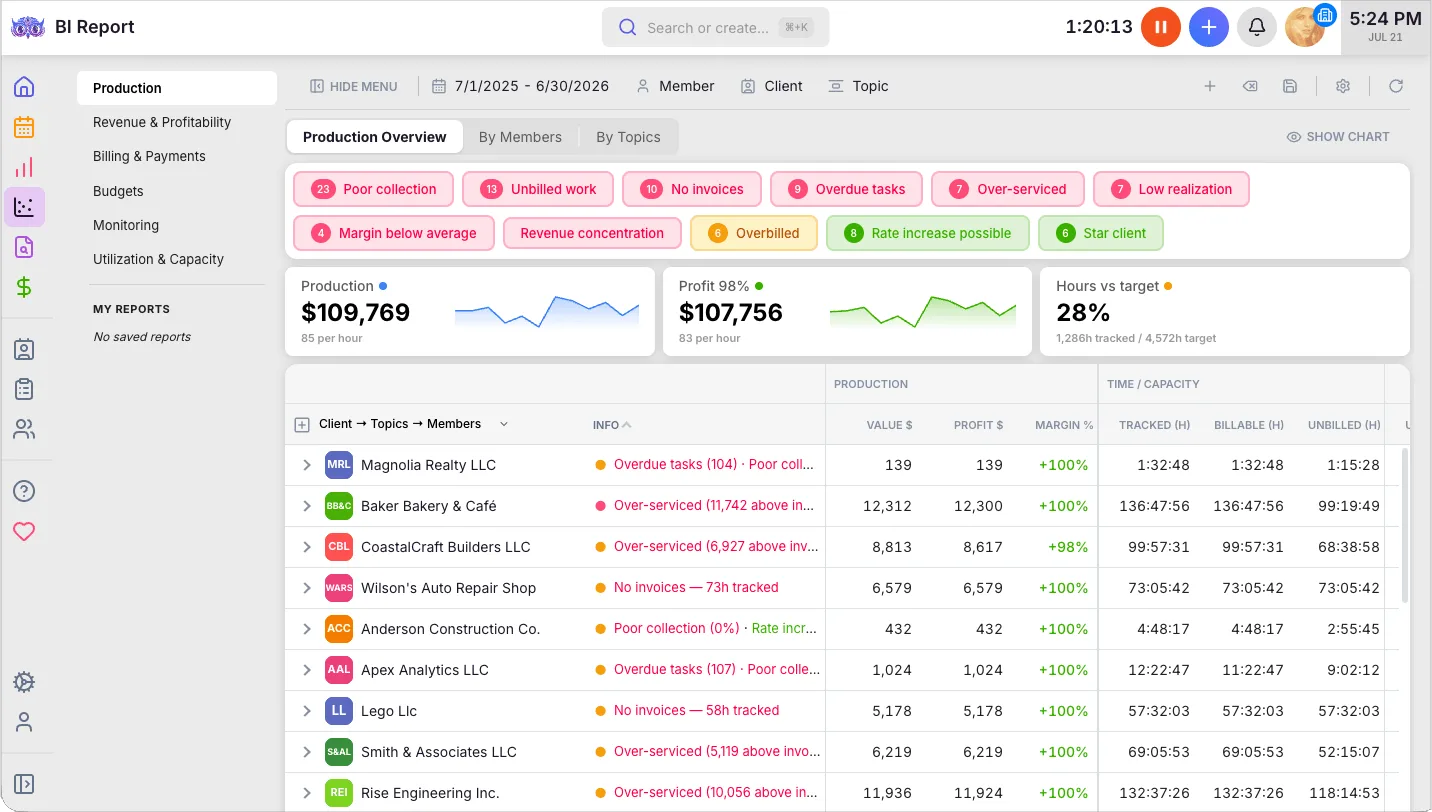
Open any client. See exactly what they're worth to your firm.
Every client's real economics in one view — production, profit margin, and the labor multiplier that shows how much value each dollar of cost returns. Your biggest client by revenue and your most profitable client stop being assumed to be the same.
- Production, profit, and margin per client — after the time they really cost
- Labor multiplier — production value returned per dollar of cost
- Drill from firm → practice area → client — every level reconciles
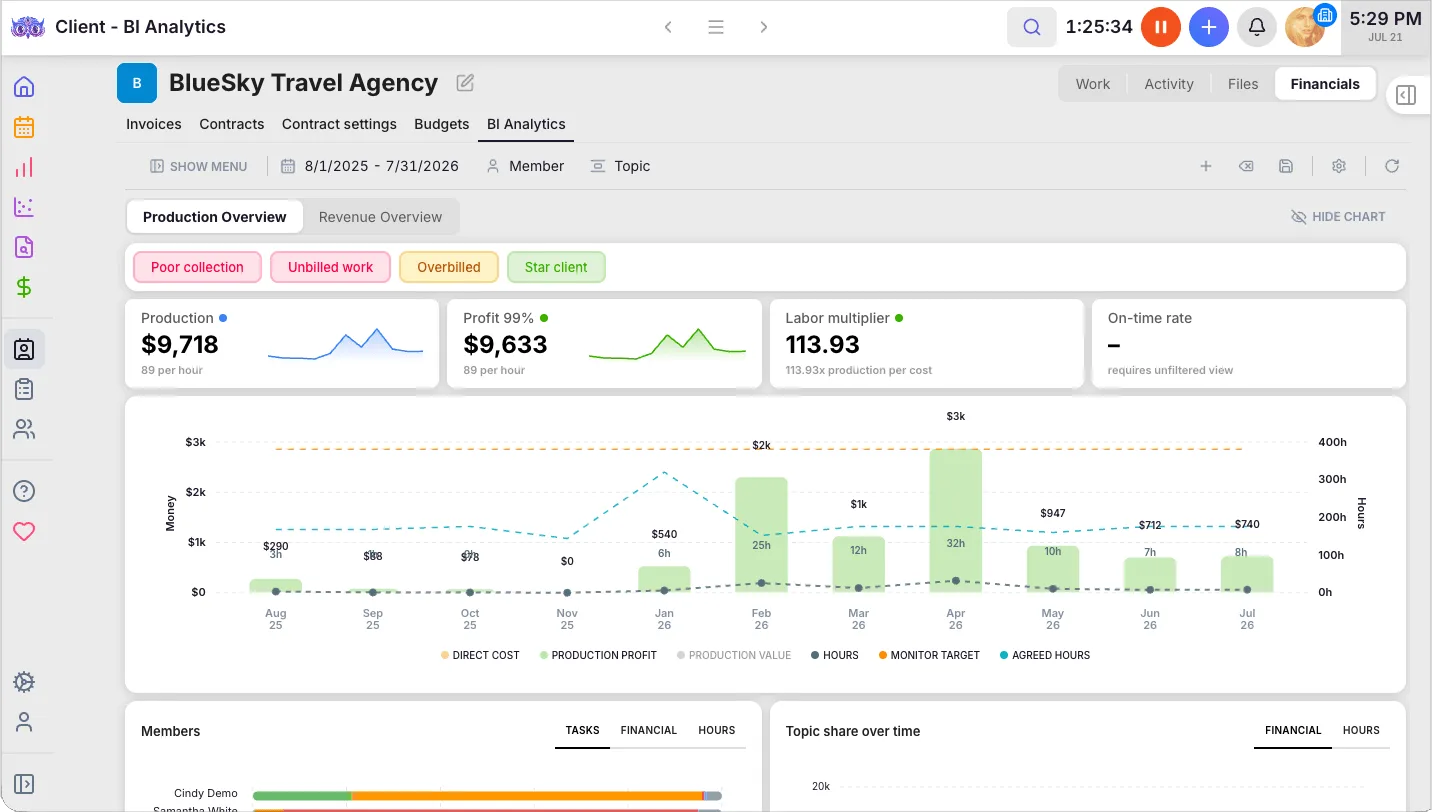
See who's carrying the firm — and who has room to grow.
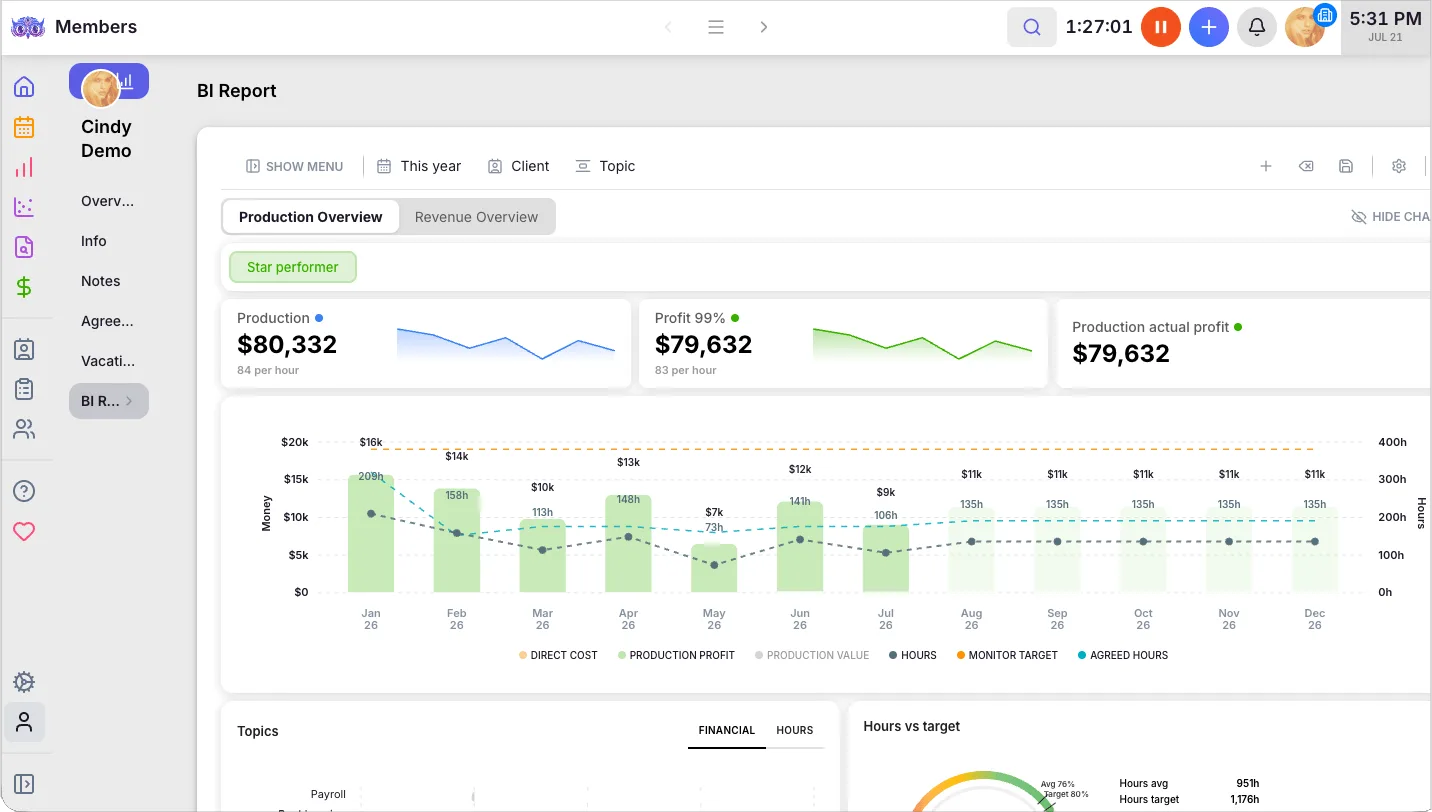
Open any team member and Uku shows their real output: production, profit, and hours against target — with the signal that flags a star performer or someone quietly overloaded, before burnout does.
- Production and profit per person — what each member actually generated
- Hours vs target — utilization against their agreement, not a guess
- Star performer or overloaded — the signal surfaces before you'd notice
From data you already have to decisions you can defend.
Set it up once
Company rates, cost, and targets — or let member agreements fill them in.
Pick a category
The report's already built and wired to the right KPIs.
Act on the signals
Health chips tell you which client, member, or service needs attention now.
- Most firms: 70% of finance time spent gathering data, not using it Uku firms: The report is already built and always current
- Most firms: A spreadsheet that's stale the moment it's published Uku firms: Live gauges that update as work and invoices land
- Most firms: “Our biggest client” Uku firms: “Our most profitable client” — and they're not the same
You can't fix a realization rate you've never seen.
Yes, Uku can show you that.
Every firm-analytics question we hear from owners and managing partners — and the answer is always the same.
- Can I see which clients are actually profitable — after all the time they really cost?
- Can I see my firm's realization rate, with a benchmark to judge it against?
- Can I see utilization by team member — and spot burnout before it happens?
- Can I see which service lines make real money and which quietly lose it?
- Can I see where revenue is leaking between delivered work and cash collected?
- Can I see a single health score per client, explained factor by factor?
- Can I see capacity gaps — the value of the hours my team isn't billing?
- Can I see budget burn vs. elapsed time, with an early-warning flag?
- Can I see compliance status across every client at once?
- Can I get analytics without building a single dashboard?
- Do the numbers drill down and still reconcile every way I slice them?
- Can I see performance right inside each client and team-member profile?
Any questions about firm analytics?
What is a good realization rate for an accounting firm?
85–95% is the healthy range; below 80% signals revenue leakage and below 70% is a serious warning. Smaller firms (<$2M) average ~92.5%, larger firms (>$20M) ~86.2%. Uku BI Analytics shows your realization live, with the benchmark band on the gauge.
What is a good utilization rate for an accounting firm?
The industry average is 60–65%, and top firms reach 70–75%. It varies by level — entry-level 80–90%, seniors 70–85%, managers 60–75%, partners 40–60%. Uku shows utilization per person against target, and flags over-work, not just under-logging.
How do I know which clients are actually profitable?
Revenue per client is easy; true profit — after the account-management time and scope creep a client silently absorbs — is not. Uku computes per-client profitability from tracked time and confirmed invoices, so your biggest client by revenue and your most profitable client stop being assumed to be the same.
What's the difference between realization and utilization?
Utilization is how much of your team's available time is billable work; realization is how much of that billed value you actually collect as revenue. One measures whether you're busy, the other whether being busy pays. Uku shows both — and explains the two utilization views that trip most firms up.
Can Uku replace the spreadsheets we use for firm reporting?
Yes. Spreadsheets go stale the moment they're published and consume ~70% of finance time in data-gathering. Uku BI Analytics is always current because it reads your live time and invoice data — no manual pulls, no formulas, no version chaos.
What's a healthy profit margin for an accounting firm?
Well-run firms run 33–40% net income as a percentage of revenue. Uku surfaces margin across five profit lenses (production, gross, operating, cash, and actual salary-obligation cost) so you see not just that you're profitable, but where.
Have a question? Contact us — real people answer.
Top-rated by accounting firms, consistently.







Explore the rest of Uku.
Deliver the work
Serve clients
Run a profitable firm
 QuickBooks
  Xero
Xero  Gmail
Gmail  Google Drive
  Dropbox
  Zapier
  Microsoft 365









Elevate your efficiency with the powerful yet easy-to-use accounting practice management software.
"Let's create a dream, where the team is happy, clients are well served and profits are fair." — Rain Allikvee, Co-founder of Uku