10 Essential KPIs That Boost Accounting Firm Profits by 25%

Last year, I watched my buddy Jake completely turn his accounting practice around. His 15-person firm in Austin was doing decent revenue-wise, but something felt off. Long hours, stressed team, and profits that should’ve been way higher given their client roster. Sound familiar?
Then Jake started tracking what actually mattered. Not the fluffy vanity metrics, but the real numbers that drive profitability. Six months later? His team’s working normal hours, profit margins jumped 27%, and everyone’s actually enjoying their jobs again. There is CAS research about it.
Here’s what I learned watching his transformation and the ten metrics every accounting firm needs to master if they want to stop working harder and start working smarter.
Why Your Gut Feelings Are Costing You Money
Look, I get it. You became an accountant because you’re good with numbers. But there’s a weird blind spot in our industry where we help clients make data-driven decisions all day, then run our own practices based on hunches.
It’s the same reason firms are encouraged to use accounting software and automate wherever possible. Across industries, cost-benefit analyses keep showing how replacing manual routines with structured, automated systems leads to clearer decisions and far fewer hidden costs.
The accounting industry is shifting fast. We’re moving from hourly billing to value-based pricing, from compliance work to advisory services. Firms that adapt are seeing 25% profit increases within 18 months of implementing proper KPI tracking. Those that don’t? They’re getting left behind.
Research shows that professional services organizations improved financial performance from 2021 to 2024, but struggled with execution. Employee utilization dropped below five-year averages, and project overruns increased by 21%. The firms winning this game aren’t necessarily working harder – they’re measuring what matters.
The 10 Metrics That Separate Winners from Survivors
1. Monthly Recurring Revenue (MRR)
Your Stability Foundation
What it measures: Predictable income from ongoing agreements like monthly bookkeeping, payroll services, or advisory retainers.
The formula: Sum of all monthly recurring service agreements
MRR = Σ(Monthly recurring service fees)
Why it’s your lifeline: MRR creates the financial stability that lets you plan ahead, invest in your team, and sleep better at night. Firms with 40-60% recurring revenue weather economic storms way better than project-dependent practices.
Jake’s breakthrough moment came when he realized he was treating monthly bookkeeping clients like one-off projects. Once he shifted his mindset to see them as recurring revenue streams, everything changed. His MRR went from $120,000 to $180,000 monthly in six months just by repositioning existing services.
Industry benchmark: Target 40-60% of total revenue from recurring sources.
2. Client Profitability Analysis
The Reality Check That Hurts
What it reveals: Actual profit per client after all costs – direct expenses, overhead, and that “quick call” that turned into two hours of free consulting.
The calculation:
Client Profit Margin = (Client Revenue – All Associated Costs) / Client Revenue × 100
This metric will punch you in the gut, but you need it. Research from business consulting shows that firms regularly discover their highest-revenue clients are actually unprofitable when all costs are considered. Jake found that 31% of his “high-revenue” clients were actually losing money due to excessive hand-holding.
Target margins: Aim for 25-40% profit margins per client. Anything below 15% needs immediate attention – either raise prices or streamline delivery.
3. Utilization Rate
Your Team’s Real Productivity
What it tracks: Percentage of available time spent on billable client work.
The formula:
Utilization Rate = (Billable Hours / Total Available Hours) × 100
Your team’s time is inventory that expires every day. The 2023 Professional Services Maturity Benchmark found that utilization rates were below five-year averages, with skills mismatches and unclear processes being major culprits.
Realistic targets by role:
- Partners: 60-70% (they need time for business development)
- Senior managers: 75-80%
- Staff accountants: 85-90%
Jake’s team utilization jumped from 68% to 84% just by implementing real-time tracking and better resource allocation.
4. Realization Rate
Where Profits Go to Die
What it measures: Percentage of billable time that actually gets invoiced and collected.
The calculation:
Realization Rate = (Amount Invoiced and Collected / Value of Billable Time Worked) × 100
Architecture firms average 91.3% realization rates, with top performers hitting 103.9%. But many accounting firms struggle to break 80% due to scope creep and poor work management.
Common profit killers:
- Scope creep without fee adjustments
- Inefficient processes extending timelines
- Poor client expectation management
Target performance: Maintain 85-92% firm-wide. Below 80% indicates systematic problems requiring immediate attention.
5. Client Retention Rate
The Economics of Relationships
What it tracks: Percentage of clients who stick with you year over year.
The formula:
Client Retention Rate = ((Clients at Year-End – New Clients Added) / Clients at Year-Start) × 100
Acquiring new clients costs 5-7 times more than keeping existing ones. Plus, long-term clients become more profitable as you learn their business patterns and work more efficiently.
Business consulting firms average 85% retention rates, with top performers maintaining 90-95%. Jake’s retention jumped 12% after linking team bonuses to retention metrics, creating shared ownership of client satisfaction.
6. Work in Progress (WIP) Analysis
Your Early Warning System
What it reveals: Real-time work progress against budgets and timelines.
WIP isn’t just about tracking – it’s about preventing problems before they torpedo your margins. Update this weekly, not monthly. By the time monthly reports come out, budget overruns have already happened.
Key metrics to track:
- Budget variance (actual vs. estimated costs)
- Timeline variance (actual vs. planned milestones)
- Resource allocation efficiency
- Mid-project profitability forecasts
Professional services organizations saw project overruns increase 21% in 2022, making proactive WIP management more critical than ever.
7. Accounts Receivable Aging
Cash Flow Reality Check
What it measures: Outstanding invoices categorized by age (current, 31-60 days, 61-90 days, 90+ days).
Extended AR will strangle your growth potential. Poor AR management remains a leading cause of practice failure.
Performance targets:
- Collect 80%+ of invoices within 30 days
- Keep less than 5% of total AR over 90 days old
- Average collection period under 35 days
Practical fixes: Automate invoicing, require deposits for large projects, and evaluate payment history during client onboarding. Uku’s automated invoice generation and payment links helped one firm cut their >60-day AR by 37%.
8. Average Revenue Per Client (ARPC)
Your Strategic Compass
What it shows: Mean annual revenue generated per client relationship.
ARPC reveals whether you’re moving upmarket or sliding toward commoditization. Elite firms generate 30-40% of their growth through service expansion to existing clients rather than new acquisition.
Break down ARPC by service type, client size, and industry to identify your sweet spots and underpricing opportunities.
9. Client Budgeting and Scope Management
The Profit Protector
What it prevents: The dreaded scope creep that kills margins.
This is where Uku’s client budgeting functionality becomes a game-changer. The platform transforms client agreements into living guardrails with flexible budget types:
- All invoices: Single budget covering every invoice for ongoing work
- By contract: Budget based on specific contracts with clear boundaries
- By project: Individual project budgets for detailed tracking
- By topic: Group related tasks under budgeted topic sets
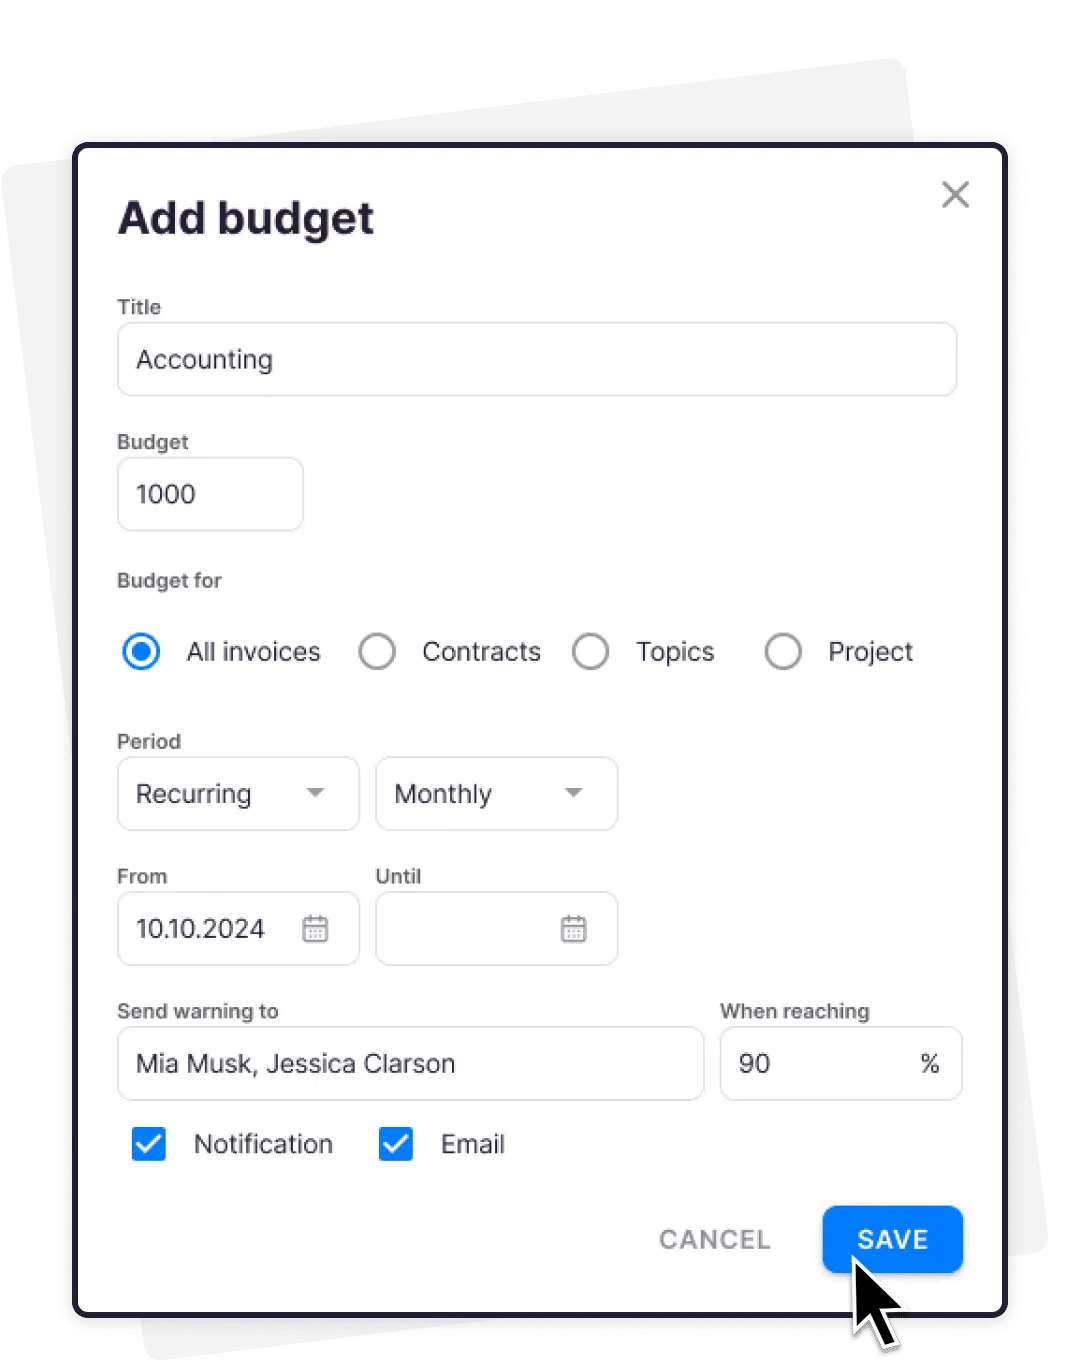
Key features that drive results:
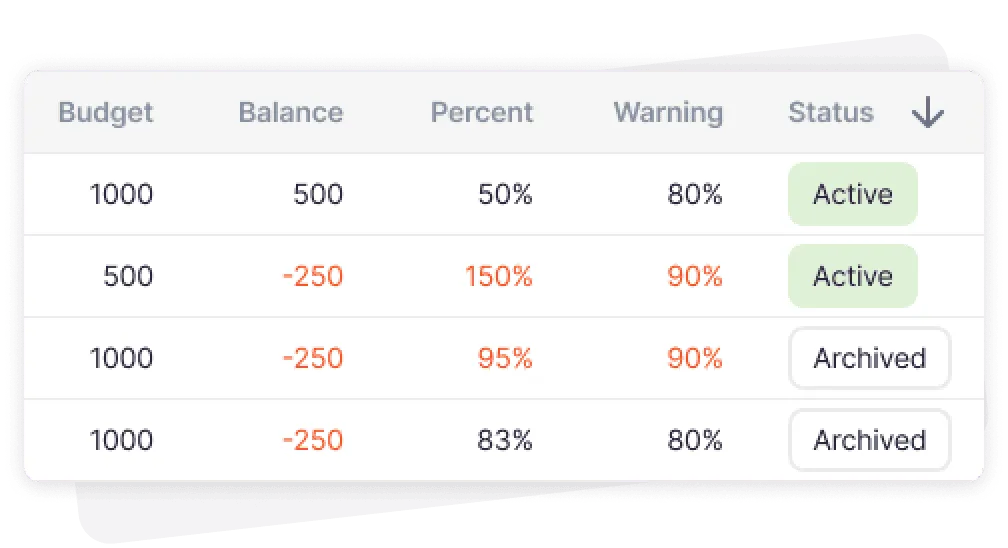
- Real-time burn alerts at 70%, 90%, and 100% budget consumption
- Historical analysis to spot chronic over-servicing patterns
- Automatic alerts under client tasks when budgets are fulfilled
Firms using Uku’s budgeting feature reduce write-downs by 28% and increase profit margins by 15% within six months.
10. Write Up/Write Down Rate
Your Pricing Accuracy Indicator
What it reveals: Variance between standard billing rates and actual amounts invoiced.
The calculation:
Write Up/Down Rate = ((Amount Billed – Standard Value of Time) / Standard Value of Time) × 100
Write-downs over 10% signal underpricing or operational inefficiency. Jake’s firm cut write-downs from 34% to 16% using budget-versus-actual tracking.
Management strategy: Review patterns monthly, identify root causes, and adjust pricing or processes based on consistent variances.
The Milwaukee Transformation: A Real Success Story
Jake’s Milwaukee accounting practice perfectly illustrates why these metrics matter. Here’s what happened when his 15-person firm focused on five core KPIs:
The Starting Point (Early 2023)
- 34% average write-downs due to scope creep
- Team utilization averaging 68%
- 40% of AR over 60 days old
- No systematic client profitability analysis
- Constant firefighting mode
The Results (Six Months Later)
Financial Performance:
- 27% increase in overall profitability
- Write-downs dropped from 34% to 16%
- MRR grew from $120,000 to $180,000 monthly
Operational Improvements:
- Team utilization jumped from 68% to 84%
- AR over 60 days decreased from 40% to 12%
- Project delivery times improved 31%
Team Satisfaction:
- Employee satisfaction scores increased 35%
- Overtime reduced by 22%
- Bonus structure tied to metrics created shared ownership
Industry Benchmarks You Need to Know
Recent research provides concrete targets for accounting firms:
Profitability Benchmarks:
- Net profit margin: Target minimum 25%
- Gross profit margin: Professional services average 30%
- CAS margins: Median 50% for all firms, 55% for top performers
Operational Benchmarks:
- Utilization rates: 75-85% for seniors, 85-90% for juniors
- Realization rates: 85-92% firm-wide
- Client retention: 85-95% for elite firms
Growth Indicators:
- 74% of firms expect 0-10% income growth annually
- 22% forecast 10-20% growth
- CAS practices report 17% growth rates
Technology: The Game-Changer You Can’t Ignore
Manual KPI tracking fails at scale. Period. The practice management system market is exploding – valued at $12.4 billion in 2023 and expected to reach $28.32 billion by 2032. The same applies across industries where efficiency determines profitability. For example, a bar & nightclub POS system plays a similar role in hospitality — streamlining transactions, managing staff, and ensuring accurate data for better decision-making.
Why Uku Dominates in Key Markets:
Uku has emerged as a leading practice management platform, particularly strong in Scandinavia where it originated, with significant presence in the UK and explosive growth in the US market. The Scandinavian software market itself grew at 8.6% CAGR between 2018-2023, reaching $17.8 billion in revenues.
Core Uku Advantages:
- Automated live metric report
- Client budgeting engine for proactive profit protection
- Integrated time tracking with browser plugins
- Automated billing and invoicing capabilities
- Real-time project progress tracking
Users report saving over 12 hours per team member weekly while raising profits 23.5% through Uku’s powerful billing features. The platform’s client budgeting functionality alone helps firms stop six figures of scope creep annually.
Implementation Strategy That Actually Works
Phase 1: Foundation (Months 1-2)
Start with three core metrics: client profitability, utilization rate, and MRR. Don’t try to track everything immediately – information overload kills momentum.
Phase 2: Expansion (Months 3-6)
Add realization rate, client retention, and AR aging. Focus on trend analysis and process improvements based on baseline data.
Phase 3: Optimization (Months 7-12)
Implement advanced analytics, predictive modeling, and automated alert systems for key thresholds.
What You Can Realistically Expect
Months 1-3: Foundation Building
- Clear visibility into actual vs. perceived performance
- Identification of hidden profit drains
- Increased team engagement with measurable goals
Months 4-9: Process Optimization
- 10-15% improvement in utilization rates
- 5-10% reduction in write-downs
- Faster AR collection cycles
Months 10-18: Sustainable Growth
- 20-25% increase in overall profitability
- Predictable cash flow patterns
- Enhanced ability to attract top talent
The Bottom Line
Every day without proper KPI tracking represents lost optimization opportunities. The accounting industry’s future belongs to firms that master data-driven decision-making while maintaining exceptional client relationships.
Jake’s transformation wasn’t magic – it was methodical measurement of what actually drives profitability. His team went from stressed and scattered to focused and profitable, all because they started tracking the metrics that matter.
The question isn’t whether you can afford to implement comprehensive KPI tracking. It’s whether you can afford not to.
Ready to transform your practice? Uku’s comprehensive platform automates KPI tracking while providing the client budgeting tools that prevent scope creep and protect your margins. With explosive growth in the US market and proven success across Scandinavia and the UK, Uku serves as the operational heart for modern accounting practices worldwide.
Founder & Visionary at Uku. Building the future of accounting practice management — where AI handles the routine so accountants can focus on what matters.

Ready to upgrade your practice management?
Join 1,000+ accounting firms already using Uku to save time and grow their business.